Fingerprint Recognition
By Žan Pušenjak
IBB, Faculty of Computer and Information Science, University of Ljubljana
biometrics
Introduction
We classified fingerprint data into impostors and genuines based on the similarity score and the type of fingerprints.
Methodology
We calculated minutiae points for each of the fingerprints by using the Bozorth3 algorithm to compute the similarity score for each pair of fingerprint data. By evaluating different classification thresholds, we determined the best one based on the number of correctly classified data. Furthermore, we assigned each fingerprint its type and only considered the bozorth value if the types matched, and again determined the best threshold.
Experiments
We worked with fingerprint data from 10 different subjects who each provided 8 samples of the same finger. The samples were 640x480 images. To compute minutiae points and Bozorth values and to determine fingerprint types and quality, we used the National Institute of Standards and Technology Biometric Image Software.
Results and Discussion
Results
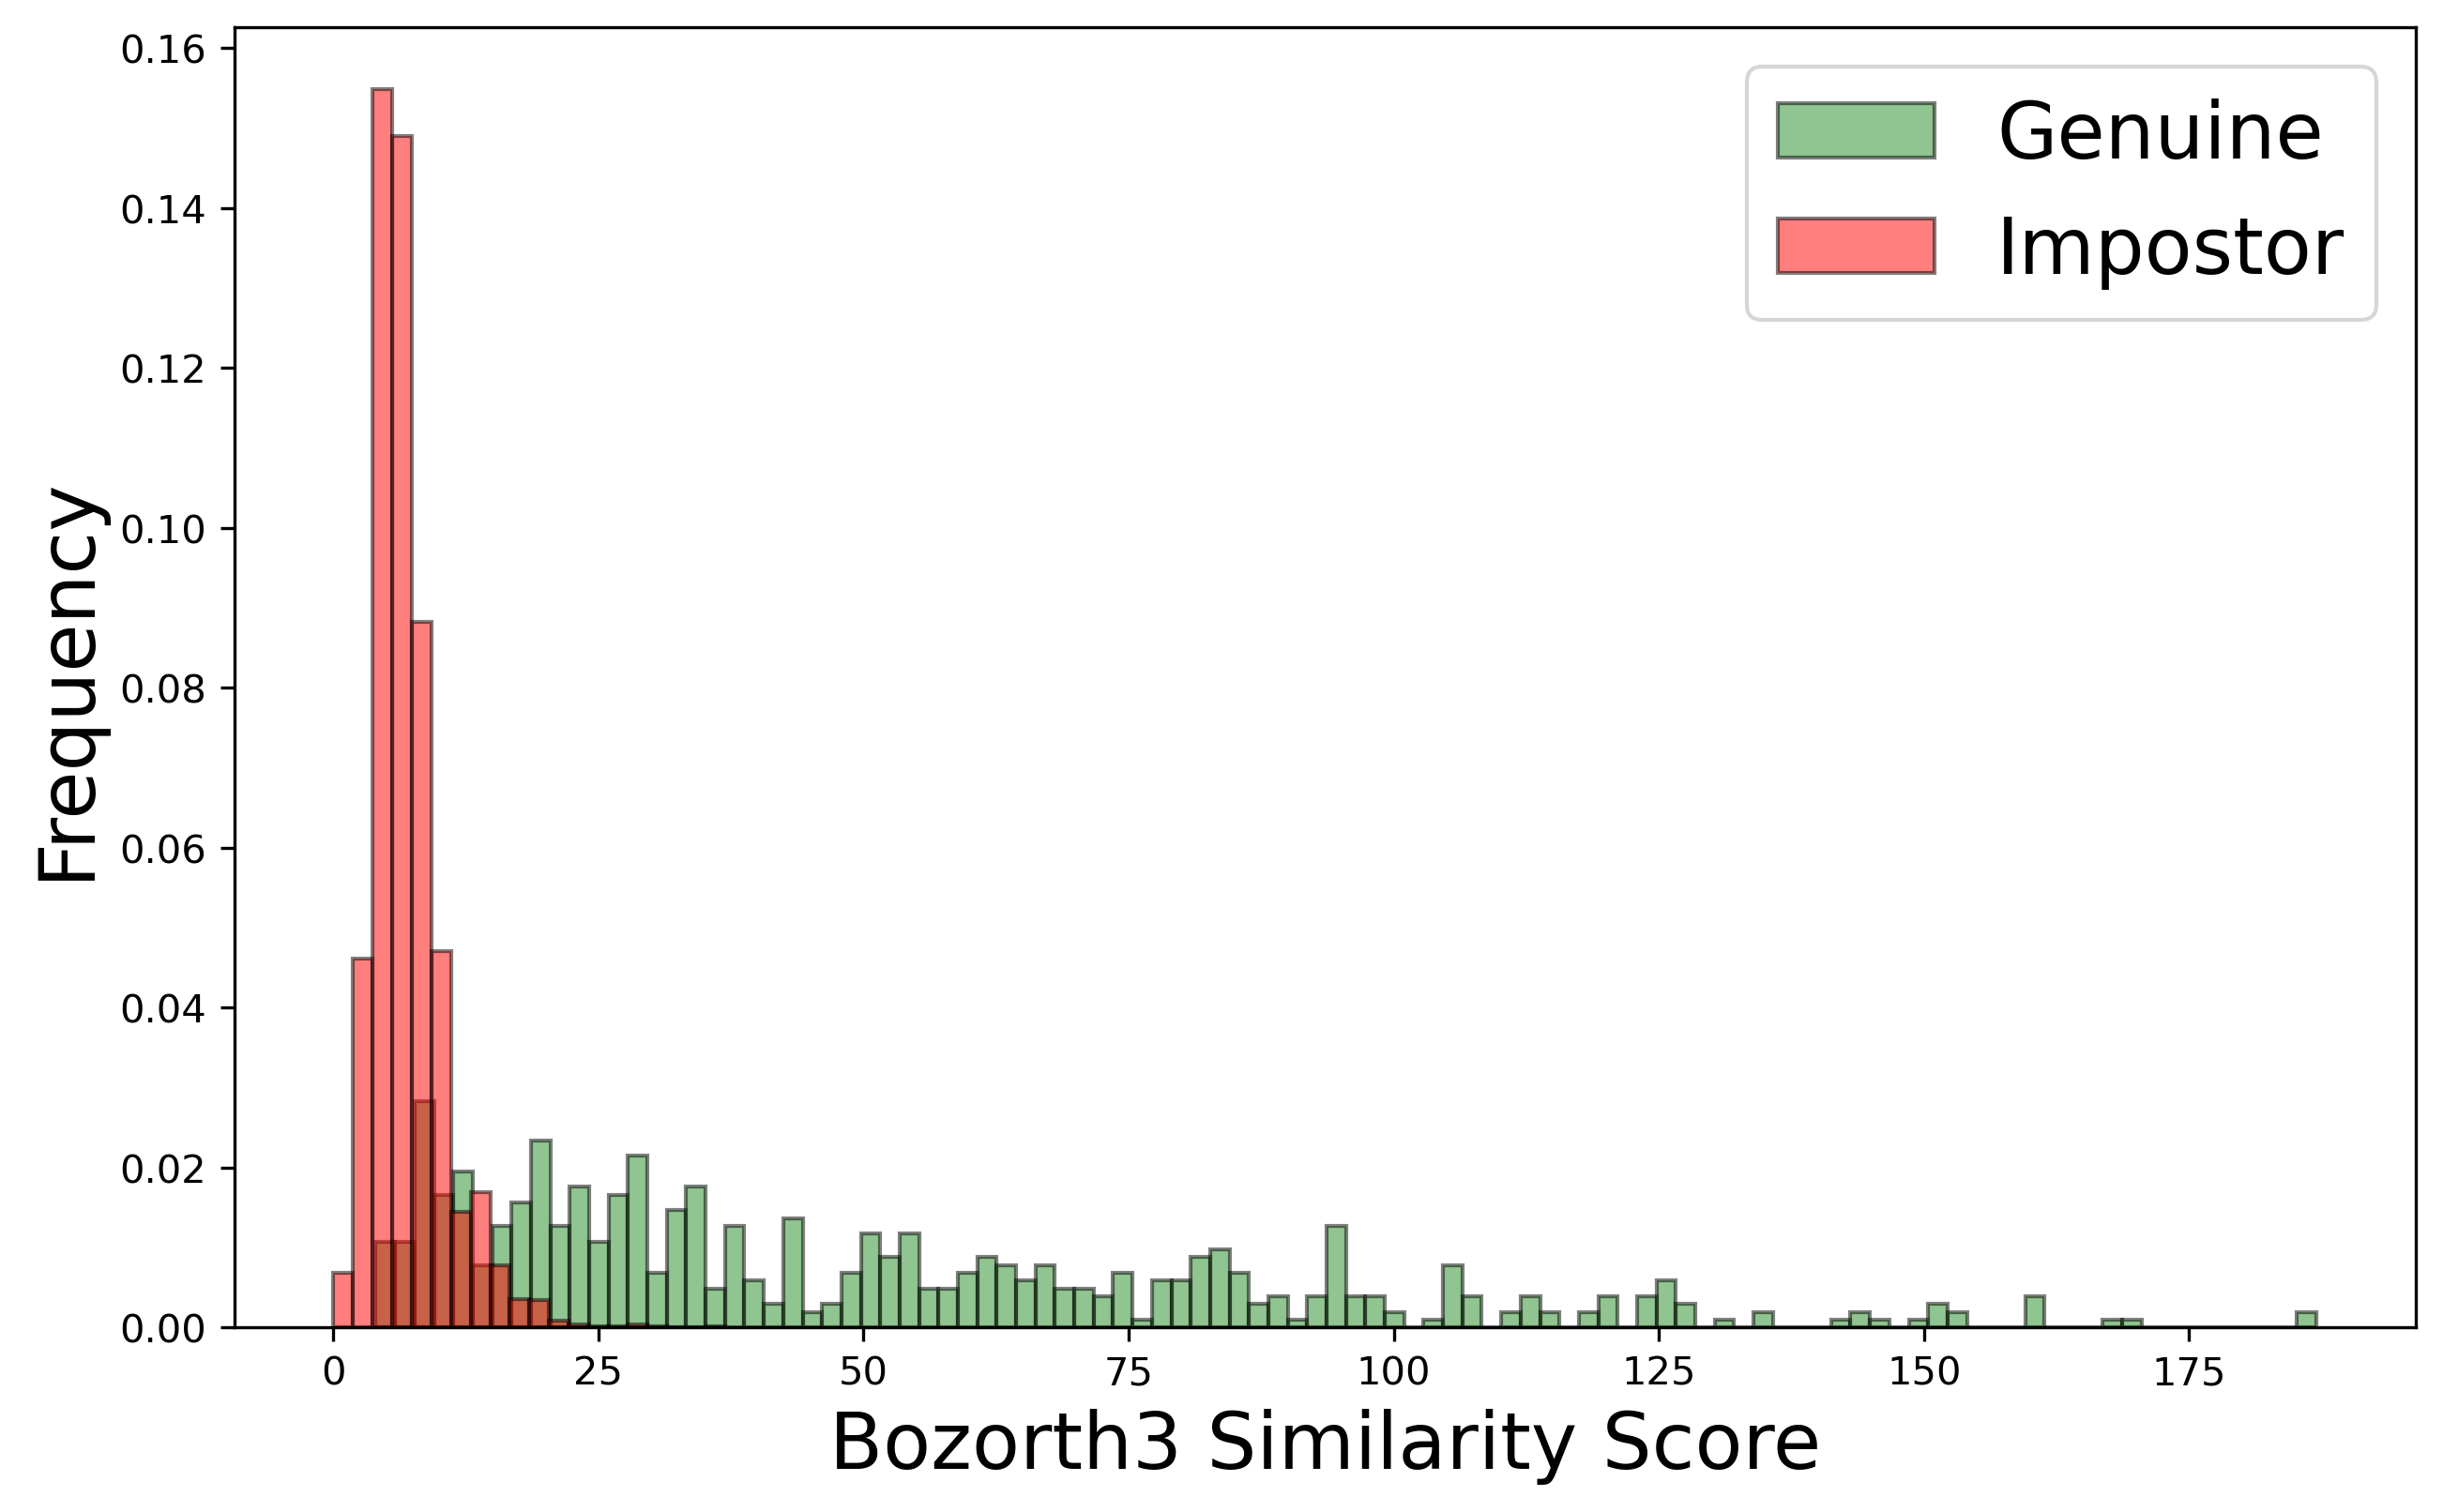
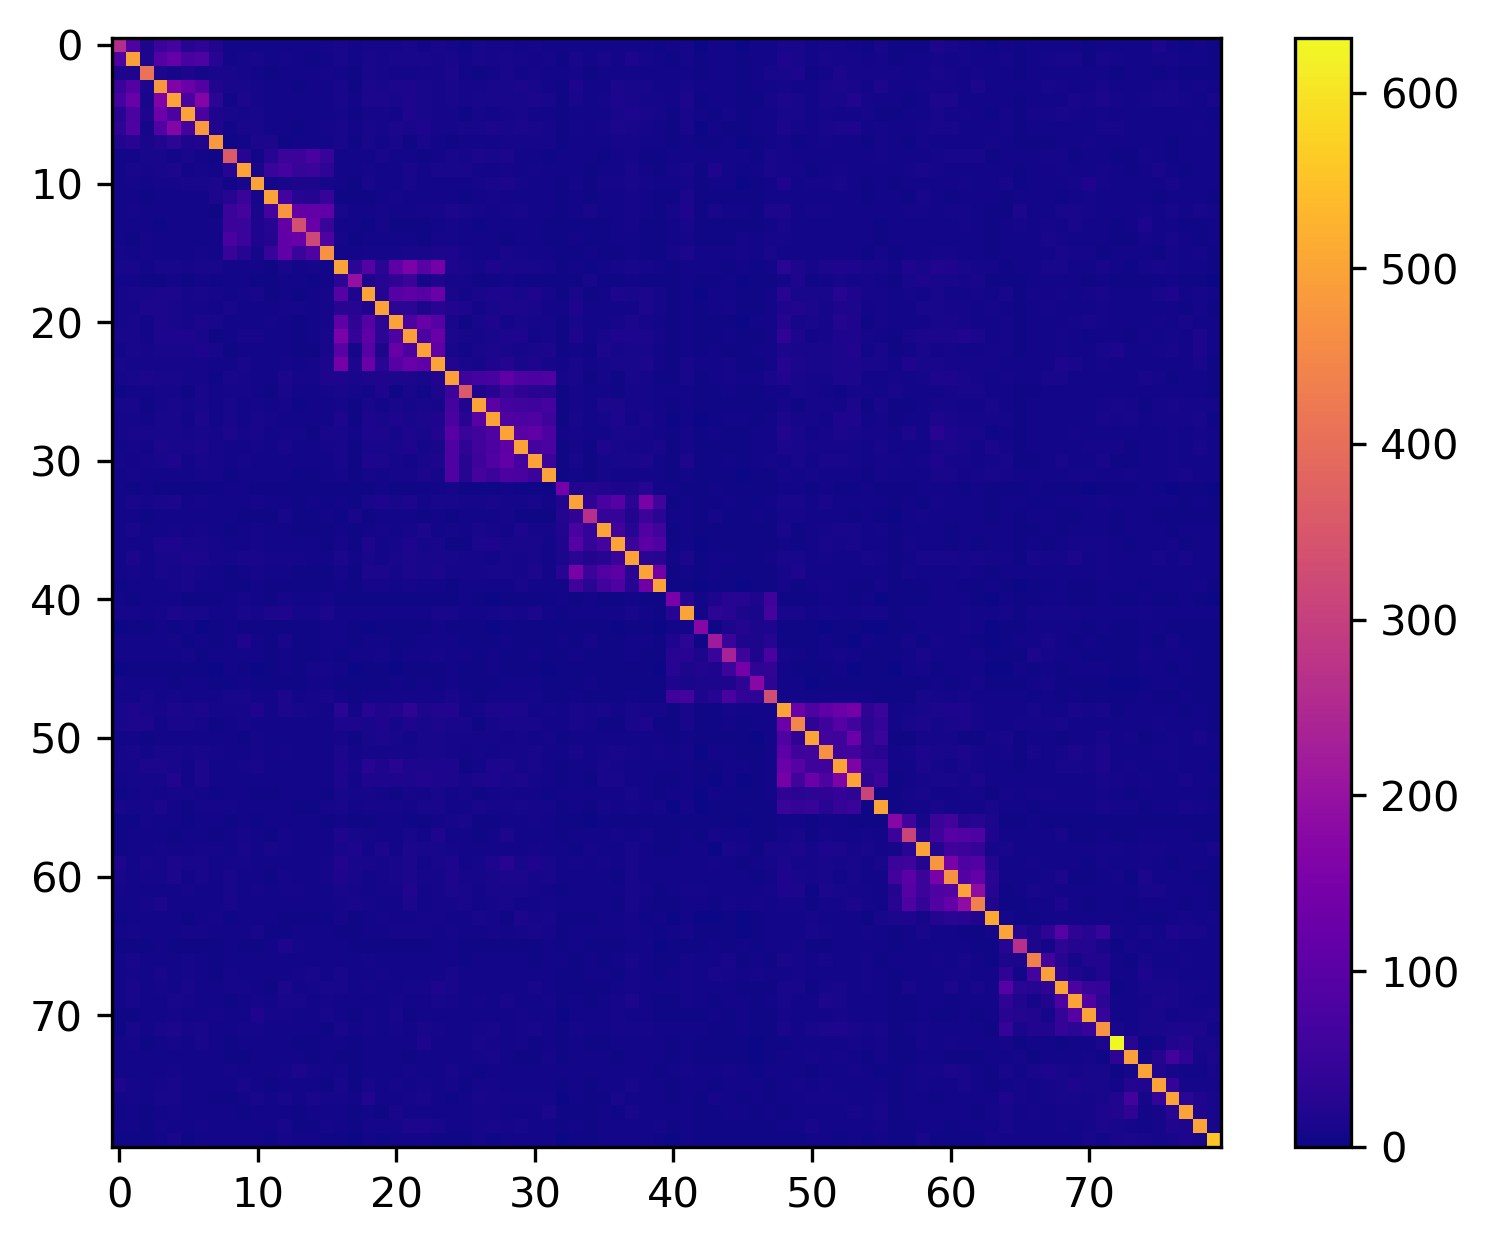
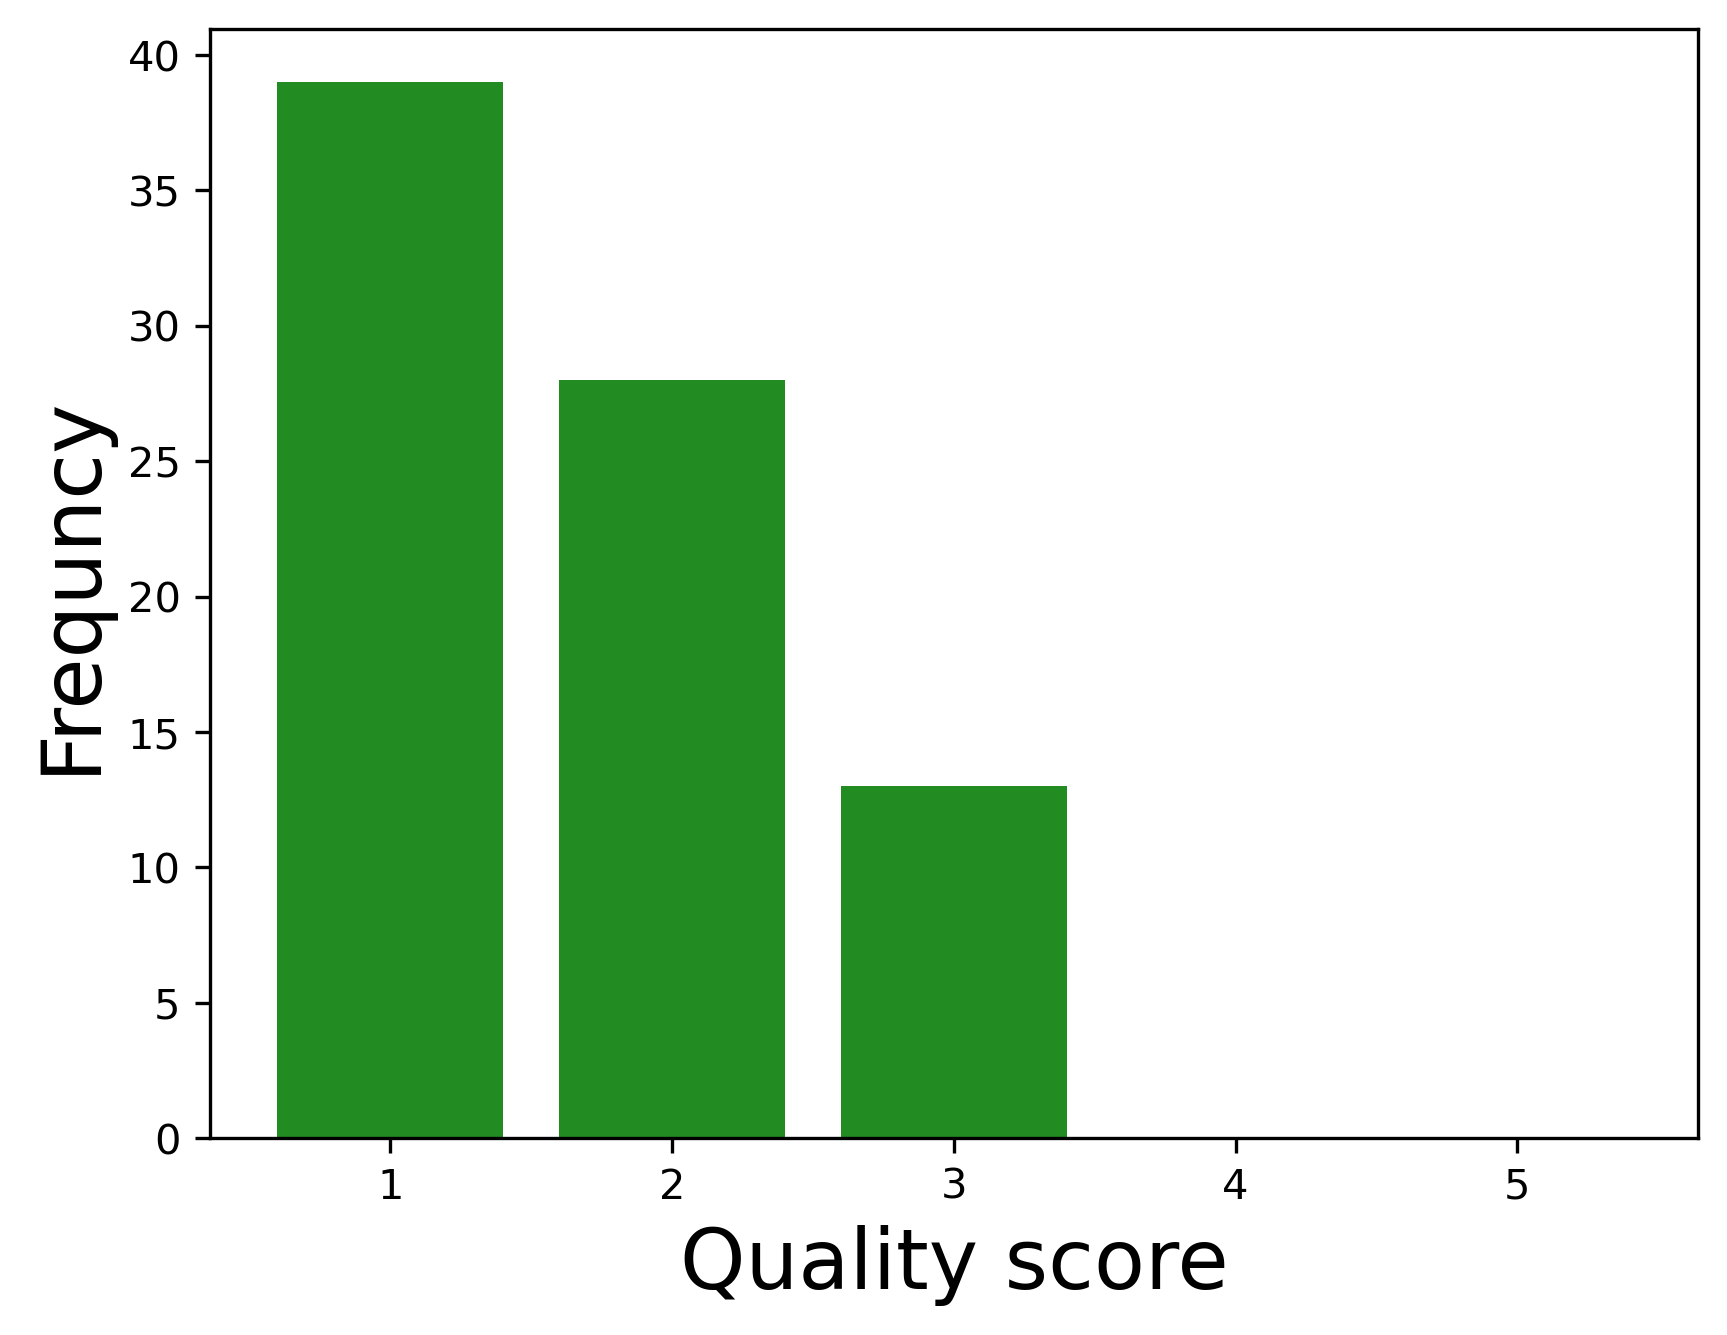
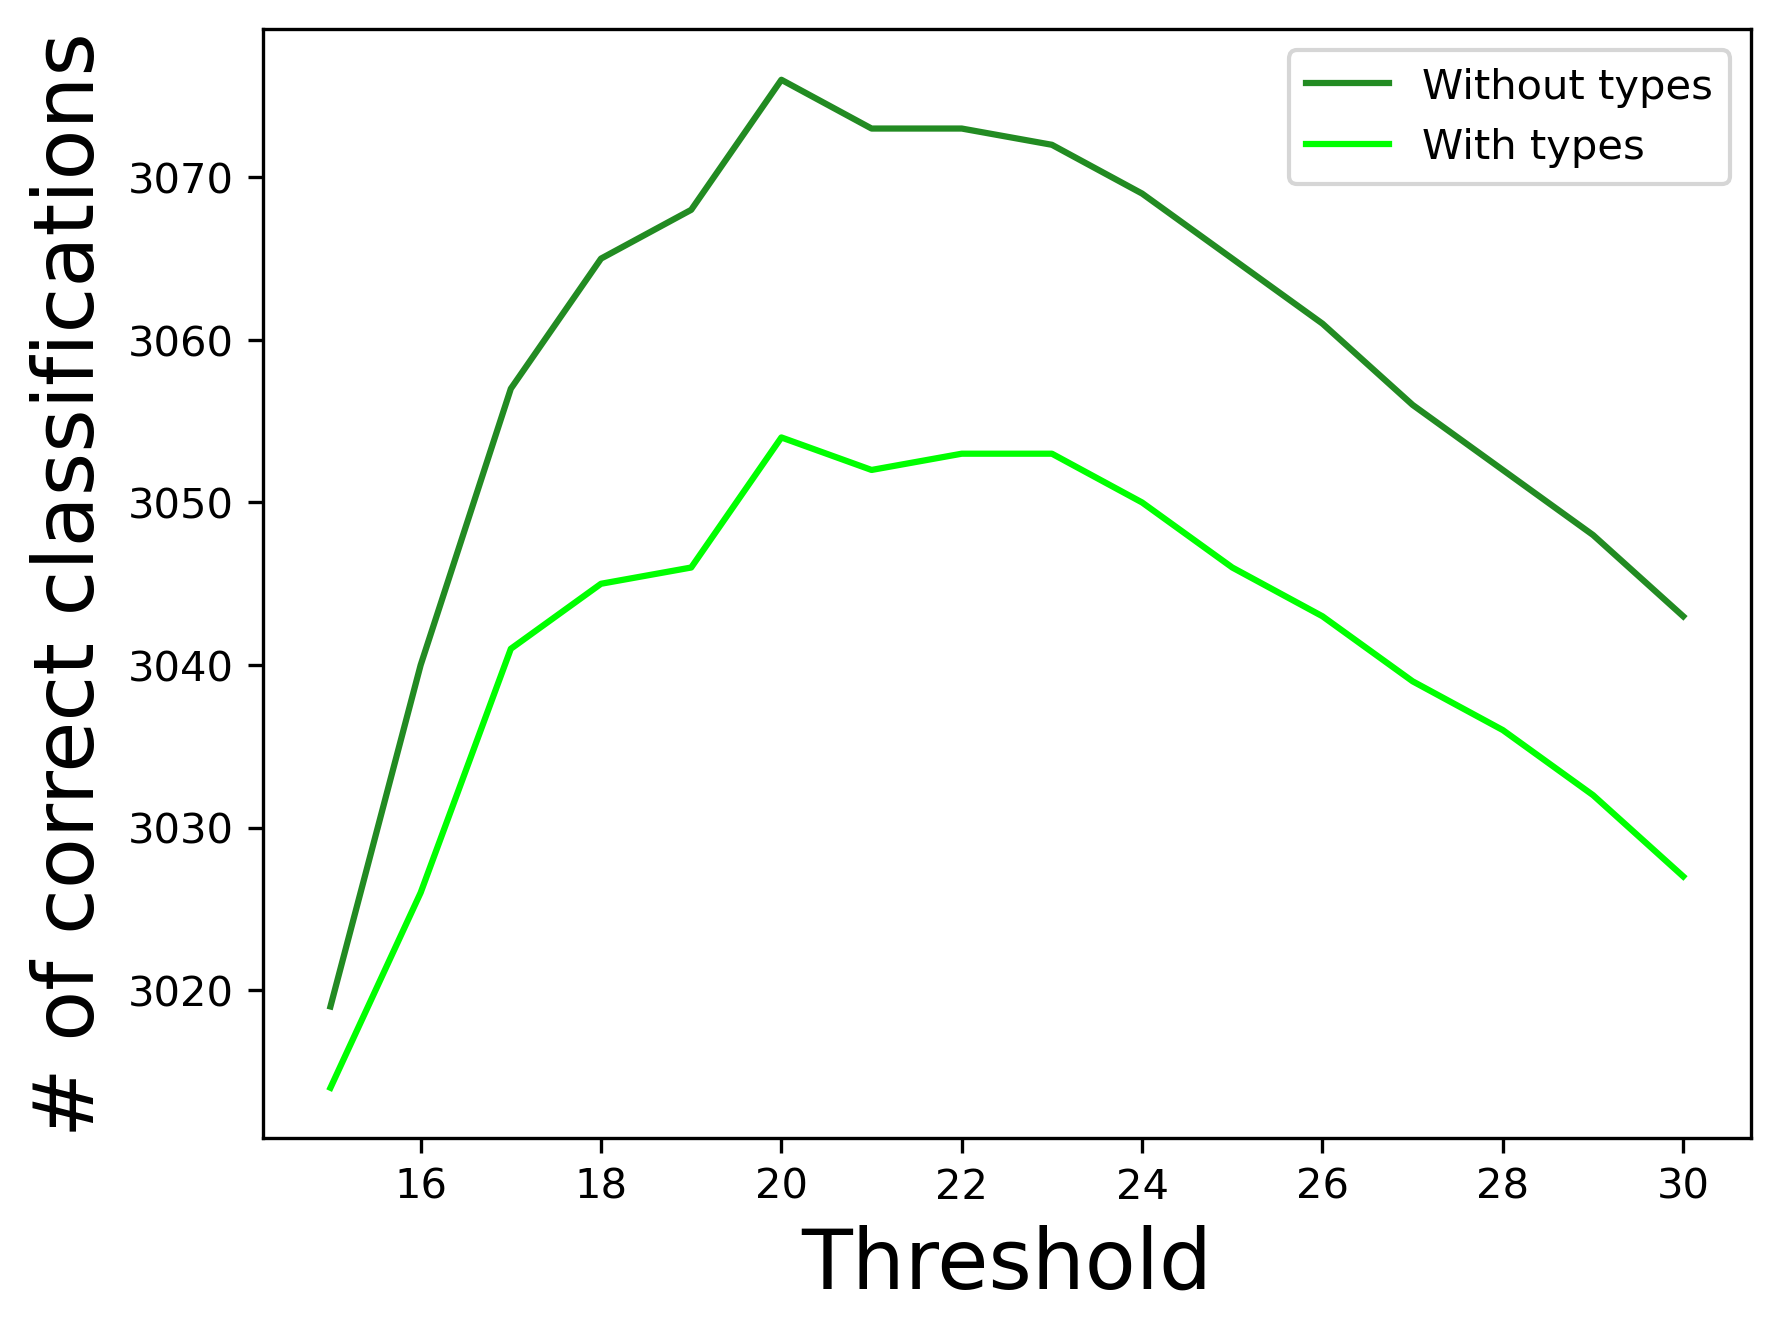
The data were not of the best quality, as can be observed in Fig.3. In addition, some fingerprints from the same subjects had low similarity scores as seen in Fig.2. In Fig.1, we can see that there is quite some overlap between the impostor and the genuine data. The best accuracy of 97.3% was obtained at a threshold of 20 as can be seen in Fig.4. Inspecting Fig.4 further shows that comparing fingerprint types first showed worse results, with an accuracy of 96. 6%. But the optimal threshold stayed the same.
Discussion
The acquired accuracy and threshold are heavily dependent on the size and quality of the dataset. In addition, Fig.4 has an anomaly at threshold 20 that could artificially make it the best threshold.
Conclusion
Even with lower quality data, the accuracy of the classification was high. We could test the accuracy even further by dividing the data into training and testing subgroups, but with 80 samples the division did not make sense.