Classification Trees and Random Forests
By Žan Pušenjak
Machine Learning for Data Science, FRI, University of Ljubljana
machine-learning
Decision Tree
We decided to build full trees, so a node was split further until we got a pure node. The splitting feature was selected using the Gini impurity.
Random forest
We further implemented the random forests using our tree model described in the first section. Each forest consisted of number of trees. To further increase the randomness we only considered features picked at random for each split where was the total number of features.
Results
Training times
The training times for TKI resistance FTIR spectral data set can be observed in table 1
| 1-2 Model | Training time in seconds |
|---|---|
| Decision tree | 3.14 |
| Random forest | 10.18 |
Model evaluation
To test the model performance we looked at the misclassification rate (denoted ) on the predictions of the test data of our dataset. We quantified the uncertainty using the formula where is the total number of predictions. Final model evaluations are seen in Table 2
| 1-3 Model | Test data | Train data |
|---|---|---|
| Decision tree | 0.316 | 0.0 |
| Random forest (100 trees) | 0.23 | 0.0 |
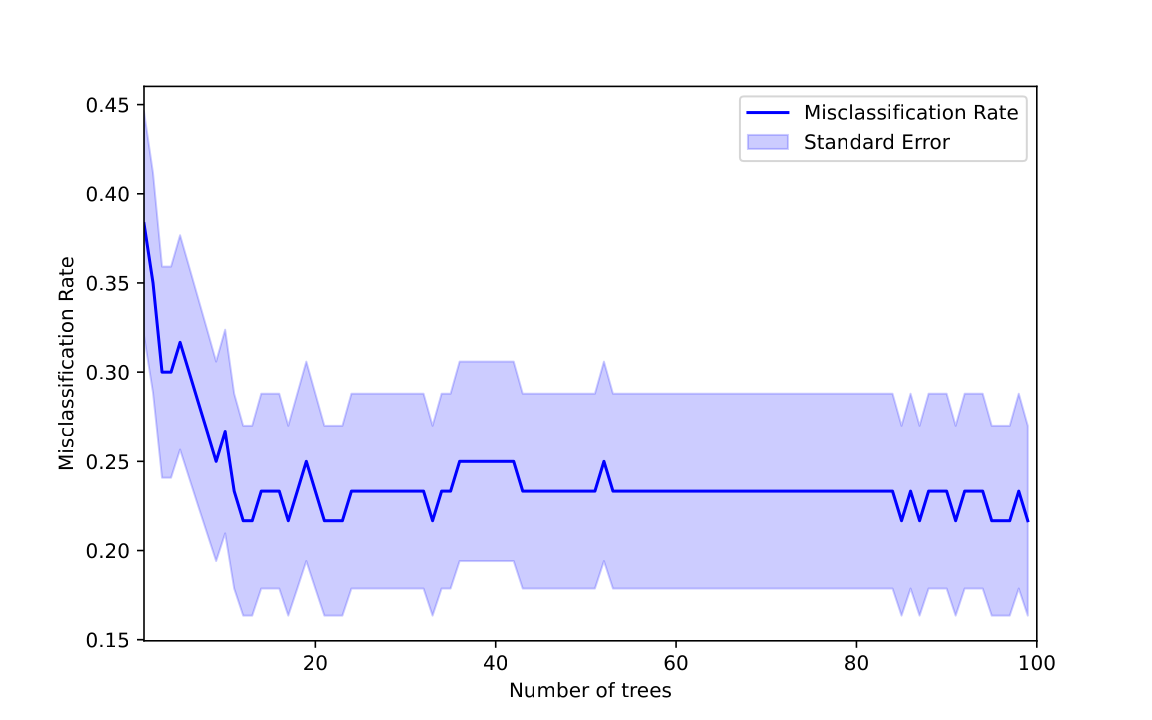
We explored how changing the number of trees in a random forest affects misclassification rates (Figure 1).
Feature importance
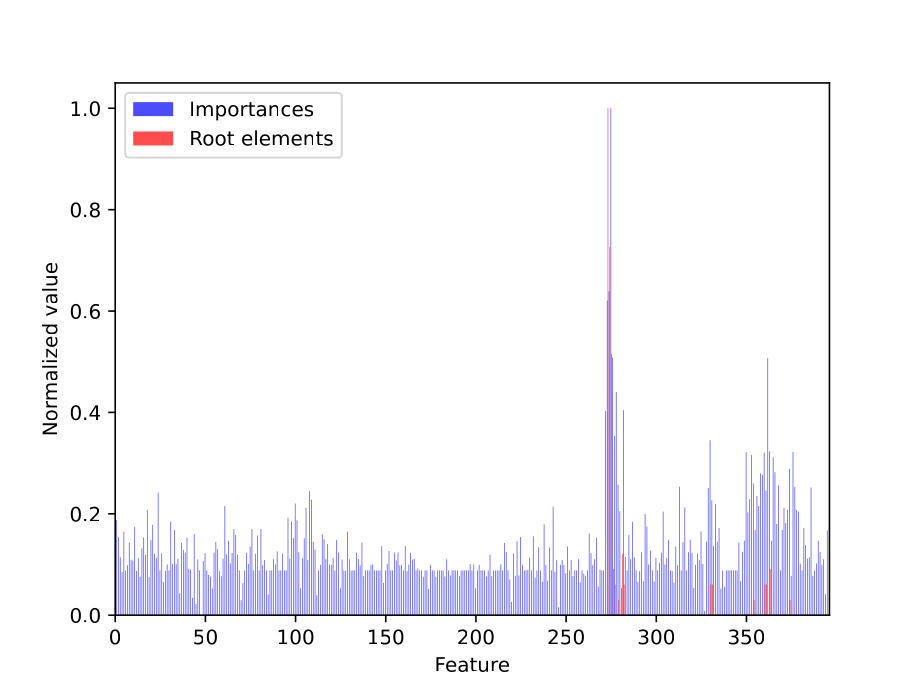
We calculated the feature importance in random trees. We used out-of-bag data to calculate the importances for each of the trees in the forest then summed them for all the trees. We built hundred full trees with bootstrapped data and compared the number of occurrences of each feature in the root of the tree to the importance of the feature. (Figure 2).
Additionally, we tried computing the importance of each 3-tuple of features using 1000 tree random forests, but the computation took too long, indicating inefficiencies in the implementation that were sadly not improved further.