Bayesian Hierarchical Models
By Žan Pušenjak
Bayesian Statistics, FRI, University of Ljubljana
bayesian-statistics
Introduction
We were tasked to answer question about global happiness levels based on two provided datasets. The cantril ladder 1 and country GDP and life expectancy 2.
Combined the datasets gave us information about country level
happiness scores over the past few years. The data consisted of five
features country, continent,
year, log_gdp (logarithm of the GDP, original
unit (before log) was US dollars) and life_expectancy and a
target variable score that ranged from 0 (maximum sorrow)
to 10 (maximum bliss), meaning that 5 is the neutral boundary between
happiness and unhappiness.
Quickly inspecting the data we observed that it was very lacking (for the amount of parameters we were tasked to infer from it) since some countries only had one or two years of data effectively giving us one datapoint for that country.
Methods
Data preparation
After joining the two datasets we first encoded the continents and countries with indexes ranging from 1-6 for continents and 1-165 for countries for easier usage.
Next we standardized the year, log_gdp
and
life_expectancy with
.
Modeling
We used a hierarchical bayesian linear model with two hierarchical
links. Here we must note that the link were horizontally
stacked, so the model only had one level of hierarchy, which simplified
the model as opposed to building a full tree level hierarchical model,
giving us a better fit with the given data.
Our model ended up being comprised of three parts:
Global level link - we used the global hierarchical link for year coefficient and intercept
andContinental level link - for all other coefficients we used a continent level hierarchical link
andWhere is the index of a country and is the index of the continent that the country is located in.
Country level prediction where is a vector
Where is again the index of the country.
Because of the large amount of parameters and lacking data we had to
alter some of the sampling parameters to get a good fit.
We ran 4 chains for 5000 iterations with a 2000 iteration warmup. We
increased the adapt delta to
and set the maximum tree depth to
.
Diagnostics
After training we checked some of the trace plots and , both of which looked fine so the training was successful.
Results
Global analysis
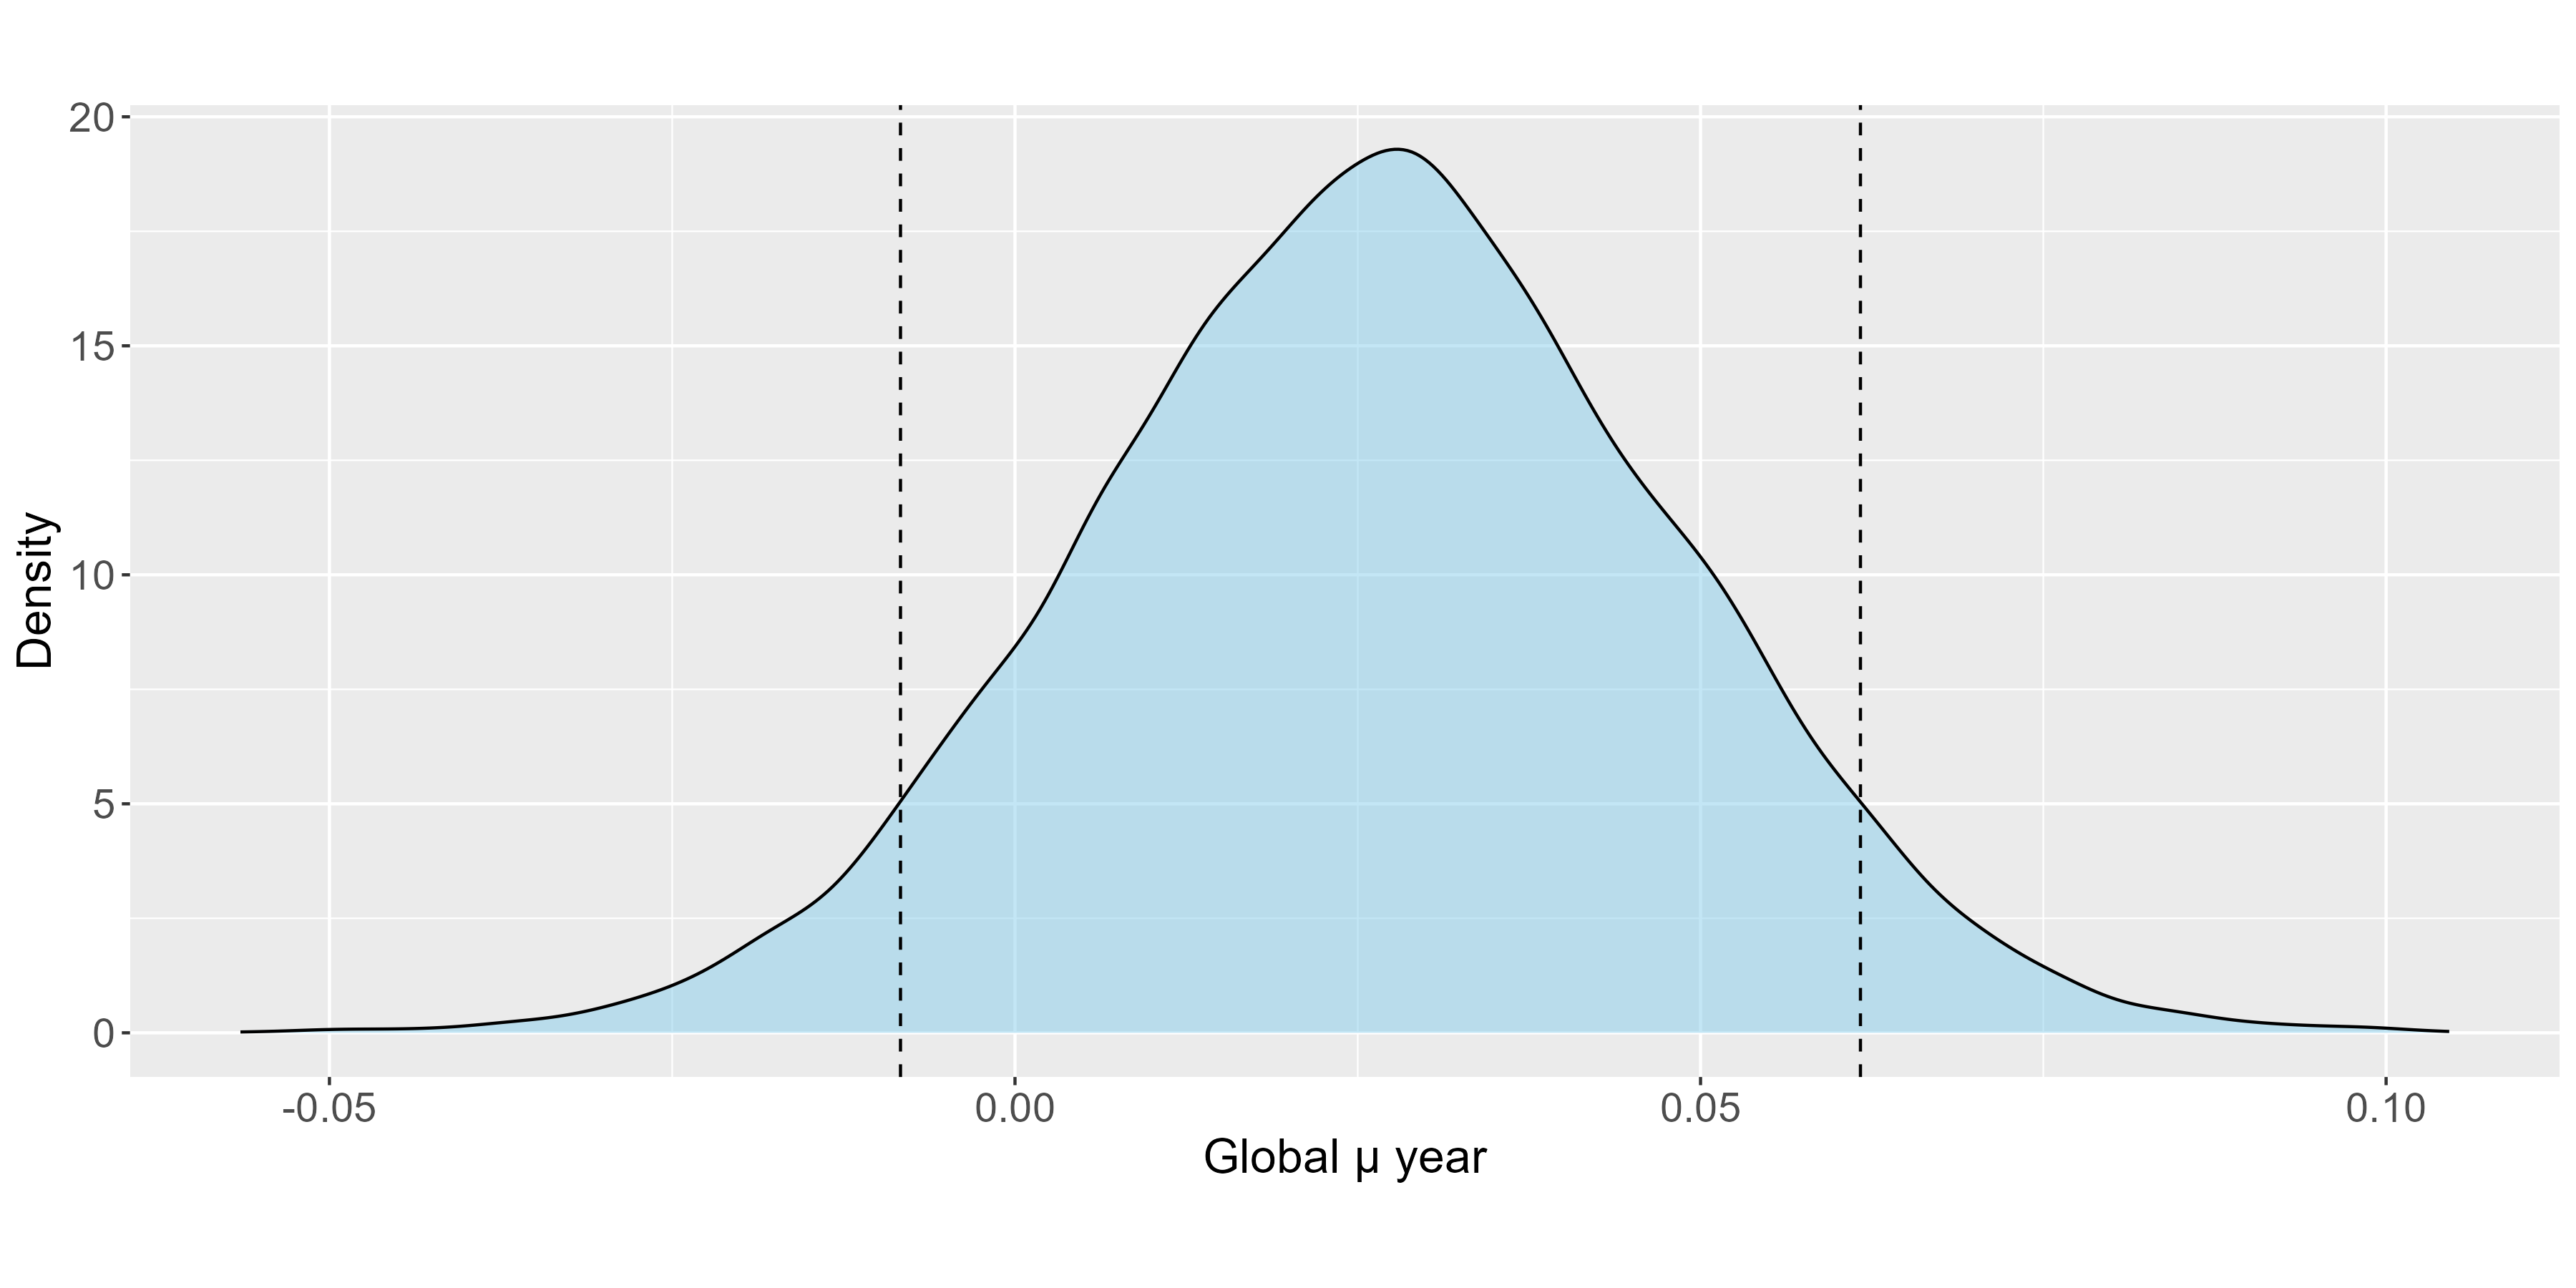
Looking at the global (Figure 1) we can be certain that happiness scores are increasing yearly. Which is a good sign for us.
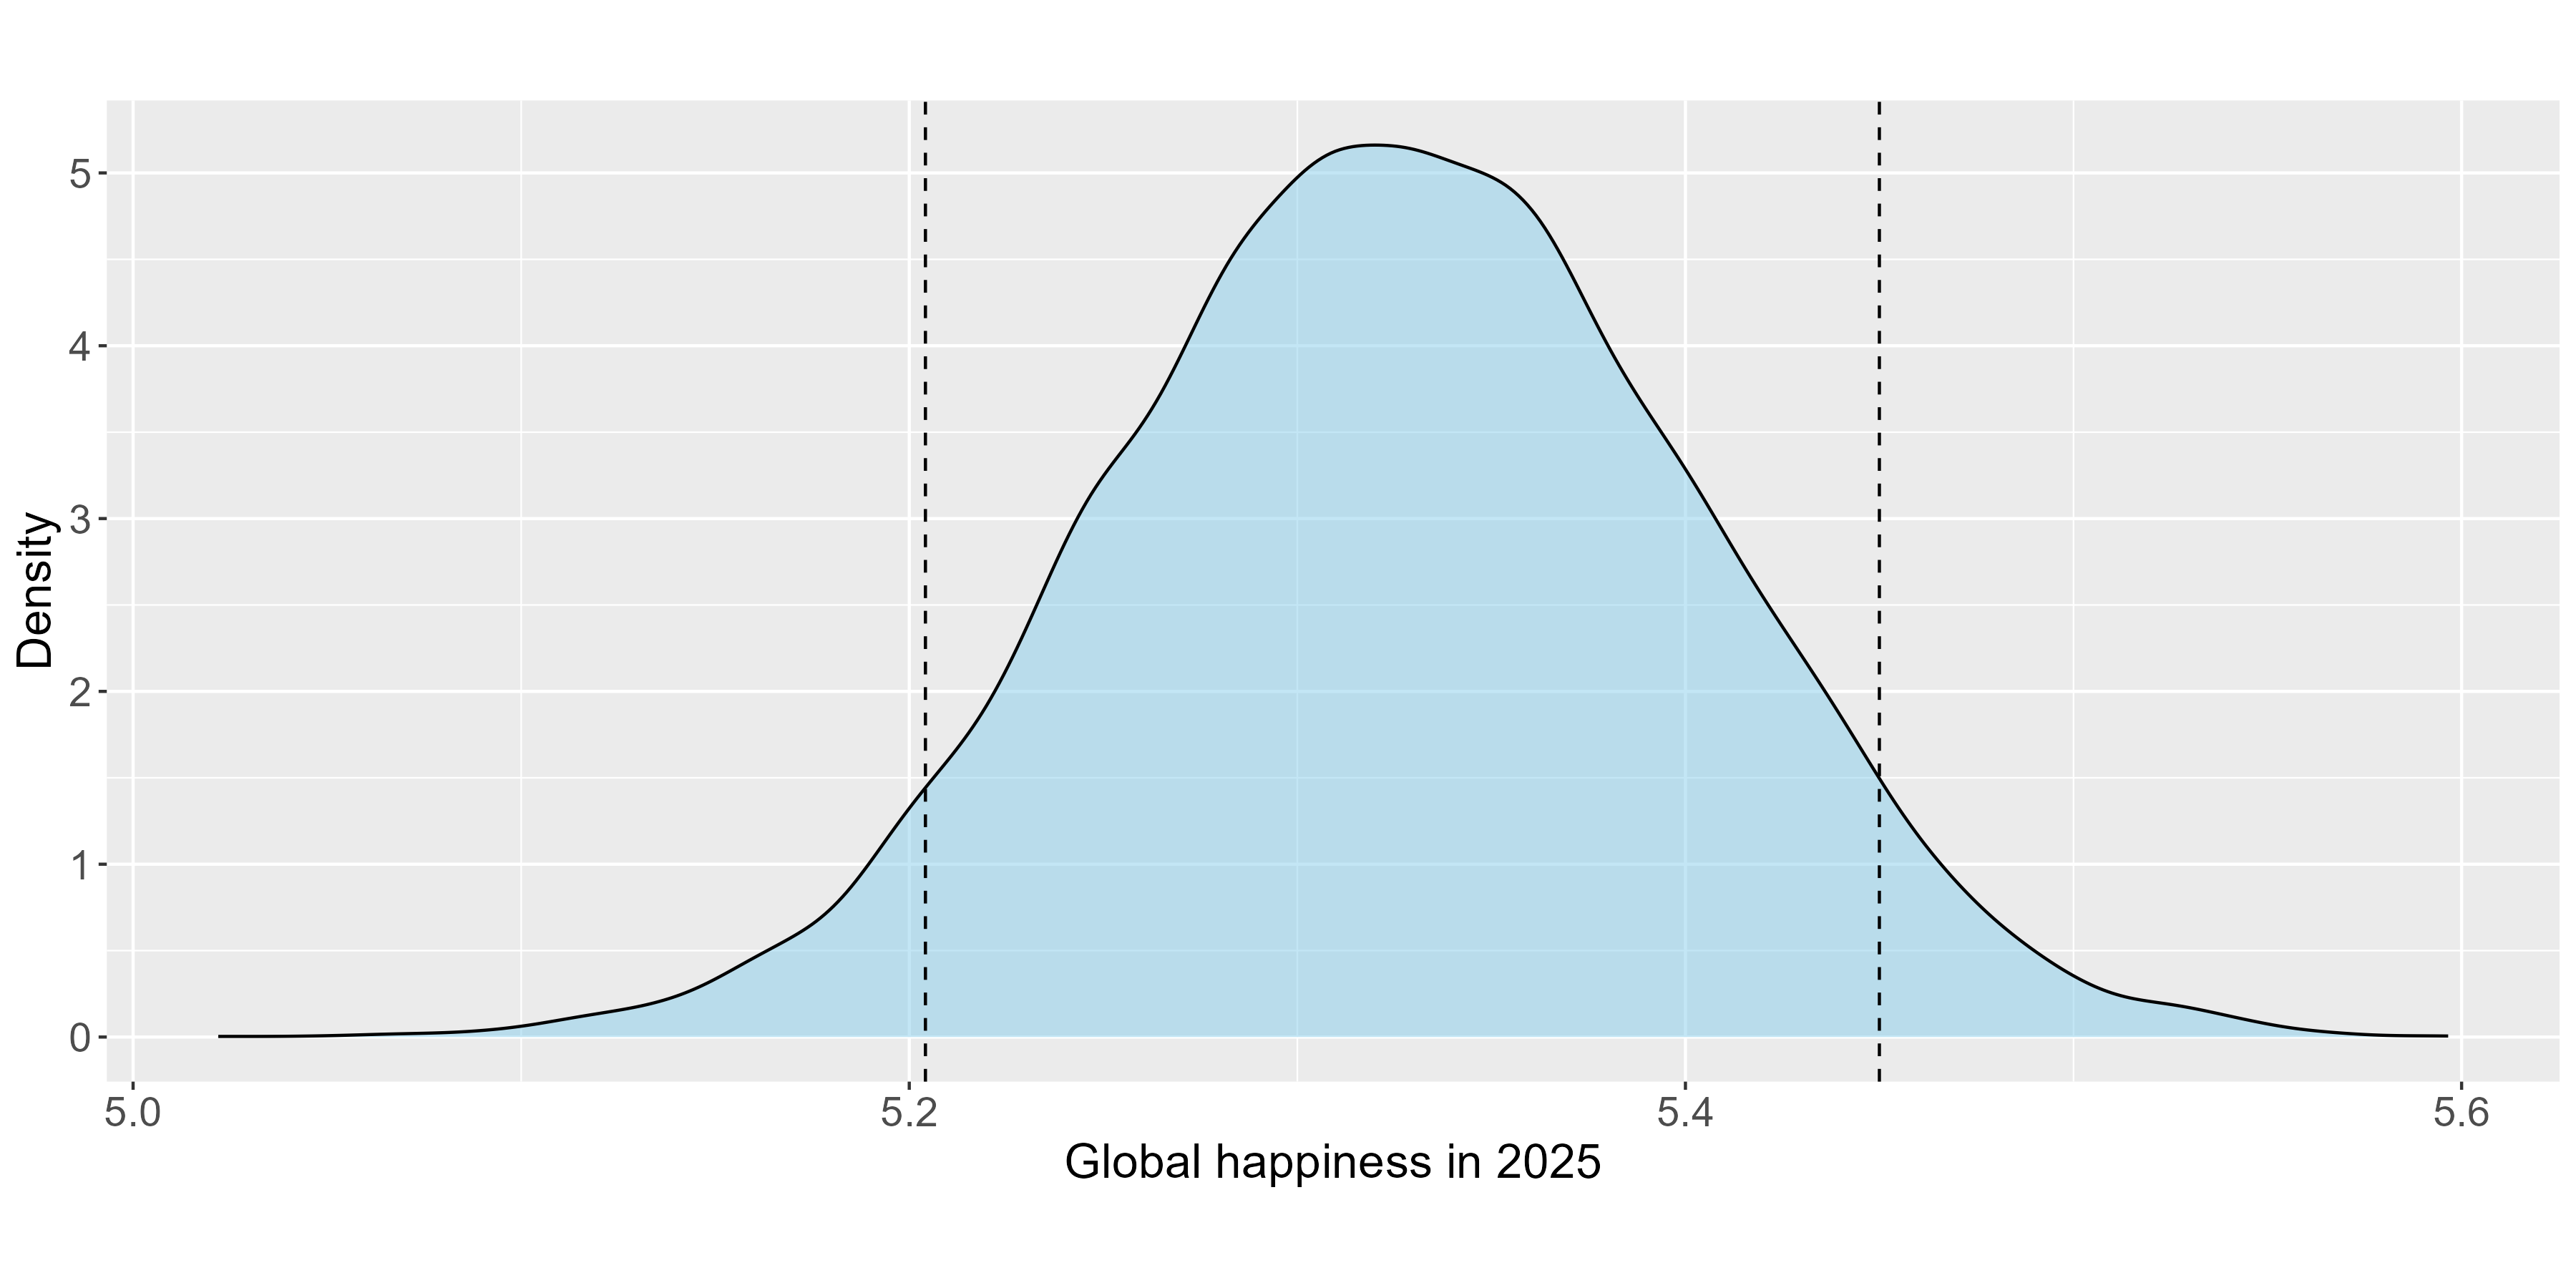
Furthermore plotting the posterior predictive of the global happiness in 2025 (calculated where is the standardized value of 2025) we can see that we can be as sure as possible that people globally are happy, meaning the happiness score is above (Figure 2). Again a pleasant finding.
Slovenia ranking
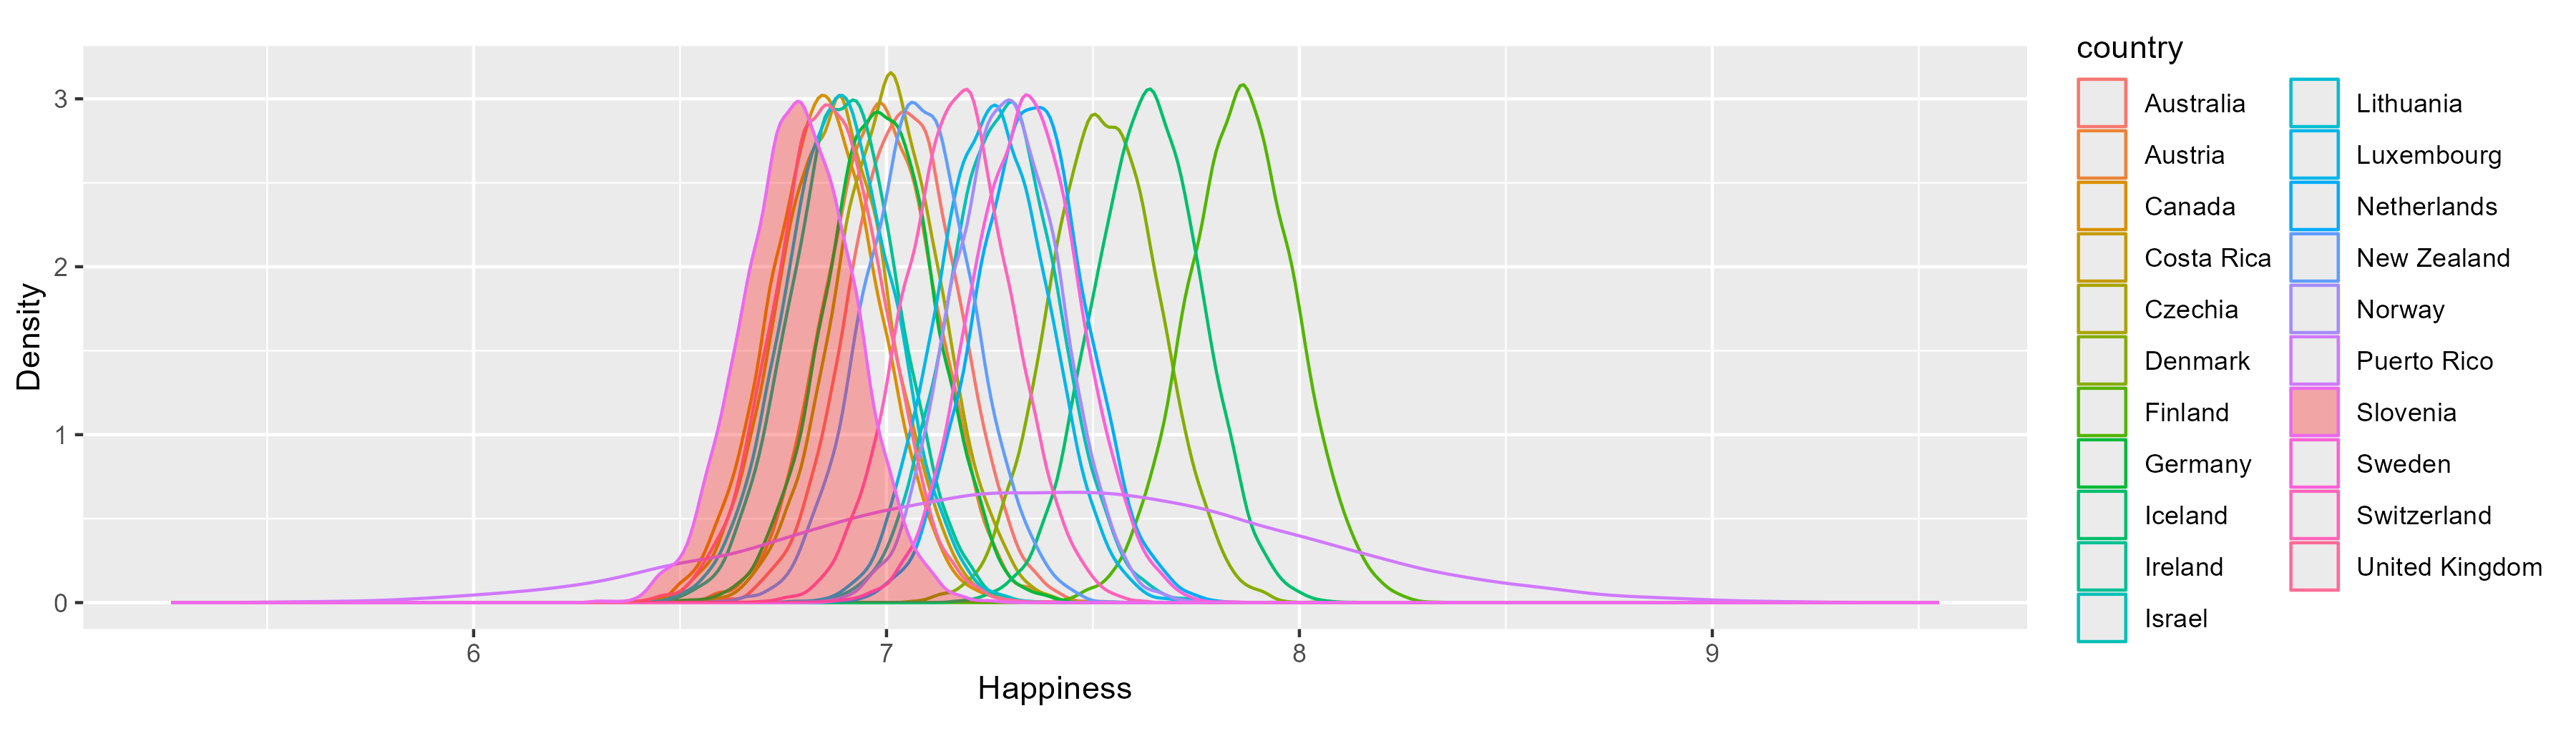
We wanted to know if Slovenia is currently (meaning in 2025) in the top 20 of the happiest countries in the world. The probability of this being true is .
Plotting the top 20 happiest countries (based on their mean happiness score value) we can further observe, how Slovenia compares to them (Figure 3)
Continental differences
Lastly we looked at how life expectancy and GDP are
correlated with the happiness scores across different continents. More
specifically we searched for any outstanding differences across the
continents.
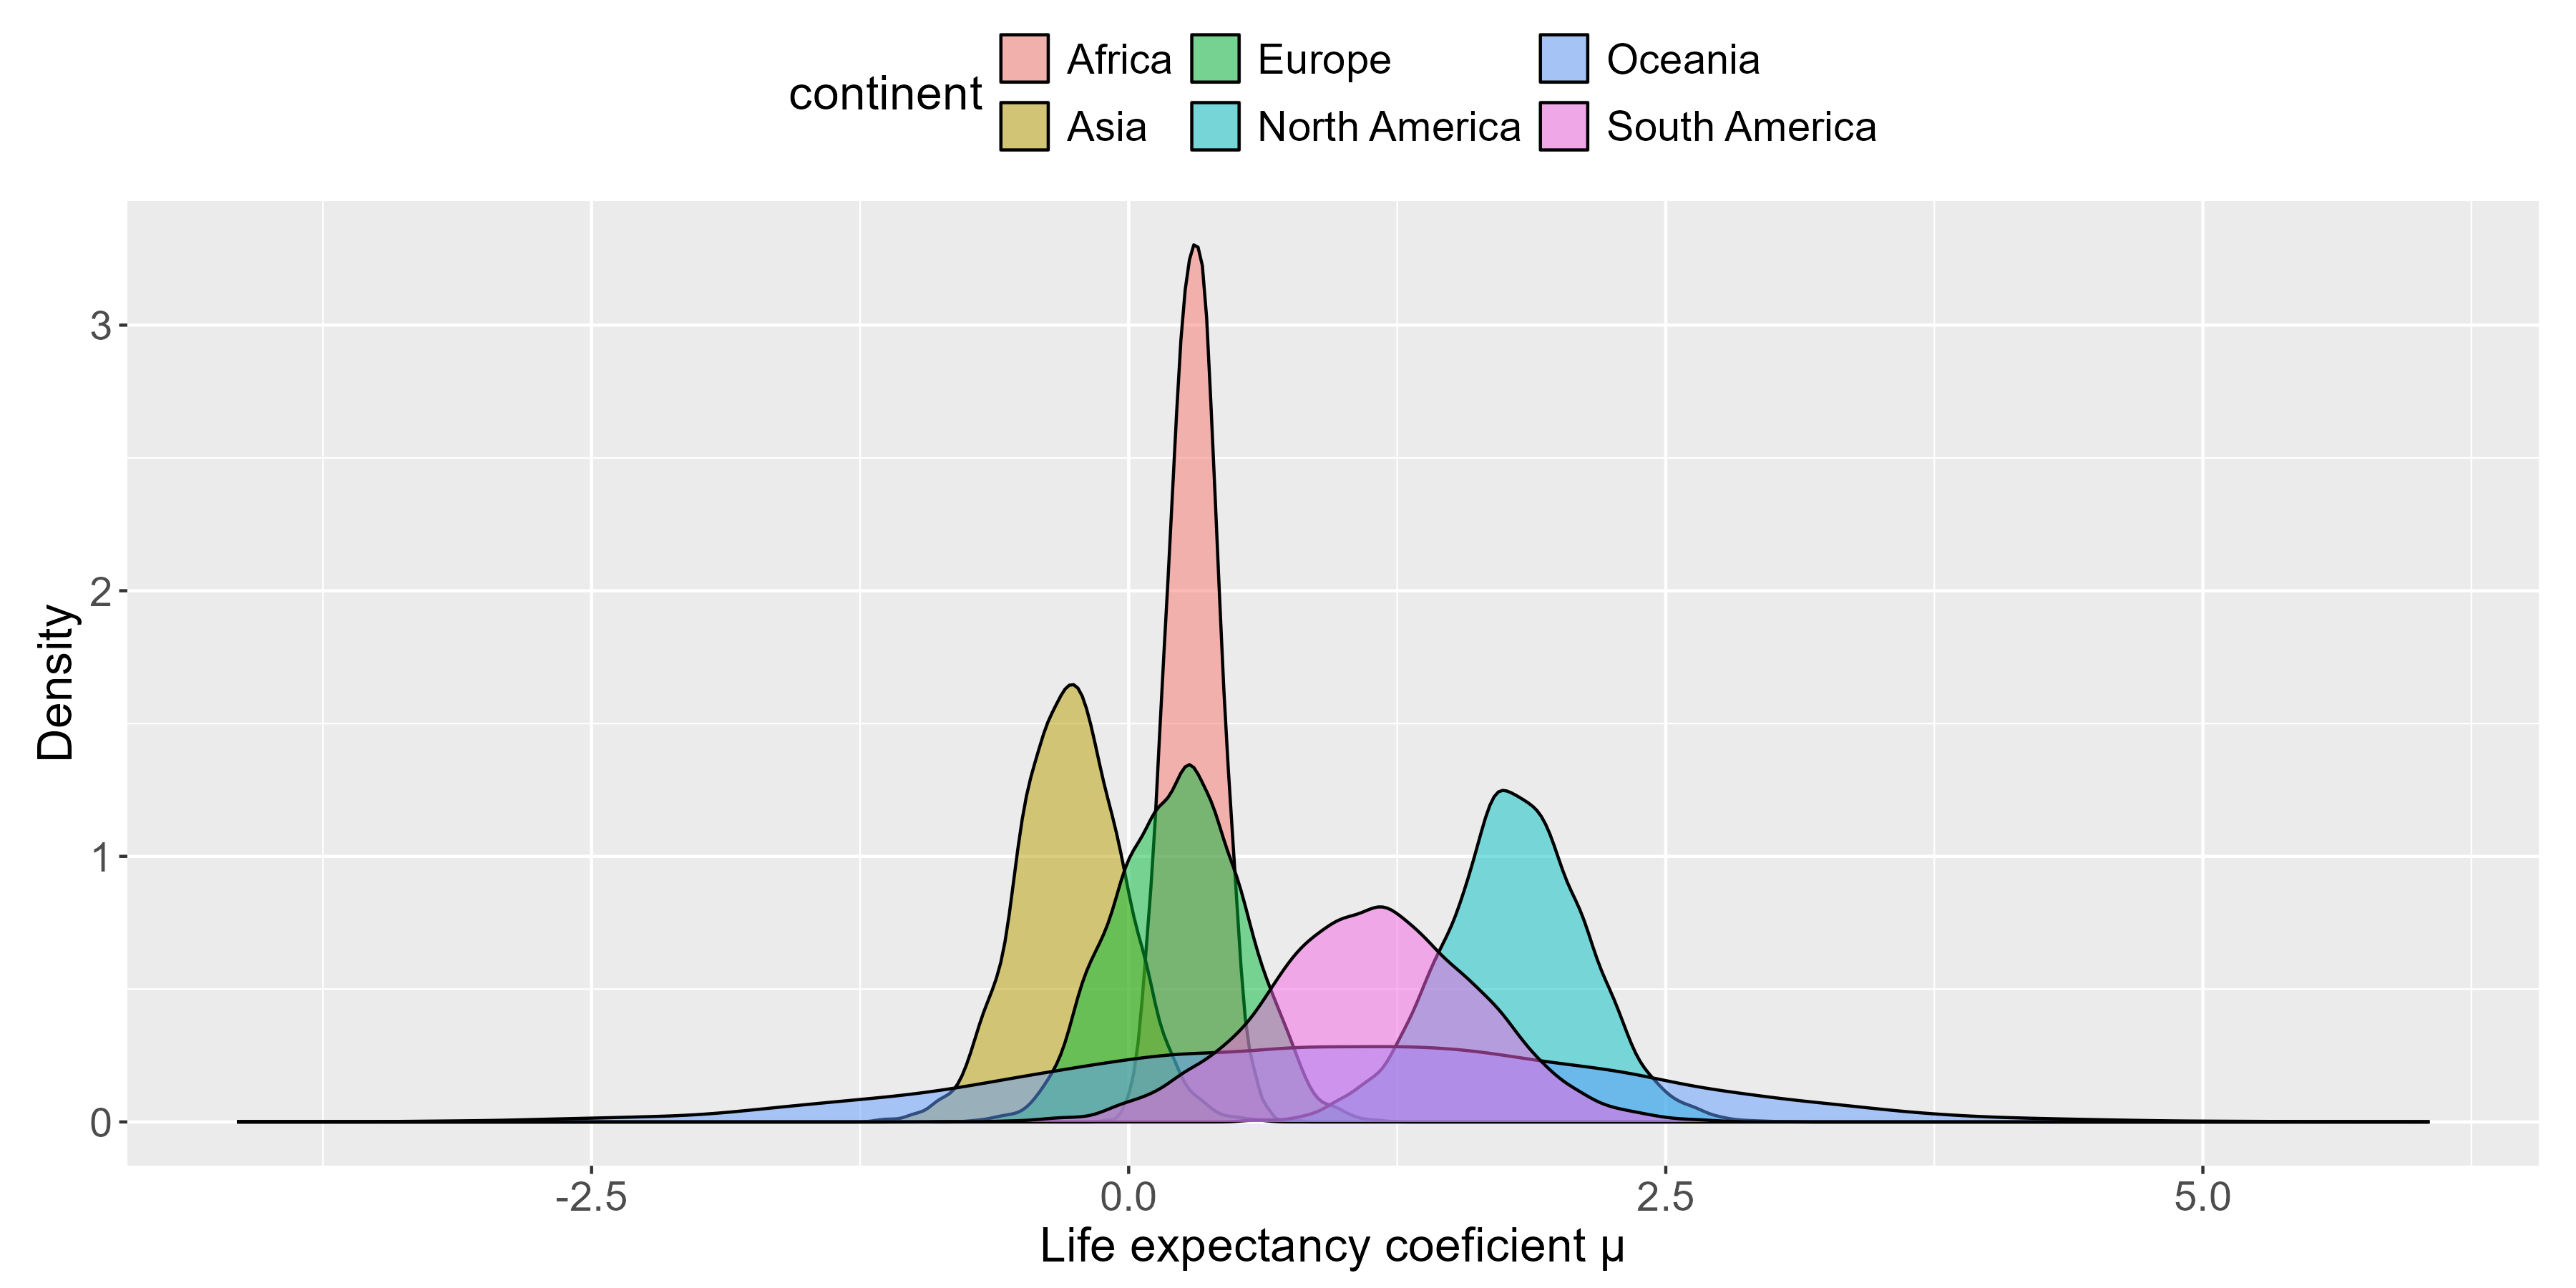
Firstly observing Figure 4 we can see that Africa and
Europe distribution means are roughly the same but
Africa has a much smaller variance. The happiness in these two
continents seems to be loosely positively correlated with life
expectancy.
North America and Asia have the most extreme cases of
correlation, where Asia is negatively correlated with happiness
and North America being the most positively correlated.
Lastly Oceania and South Africa, similarly as
Africa and Europe, have similar distribution means but
what stands out with these two continents is their variance,
Oceania in particular has very large variance.
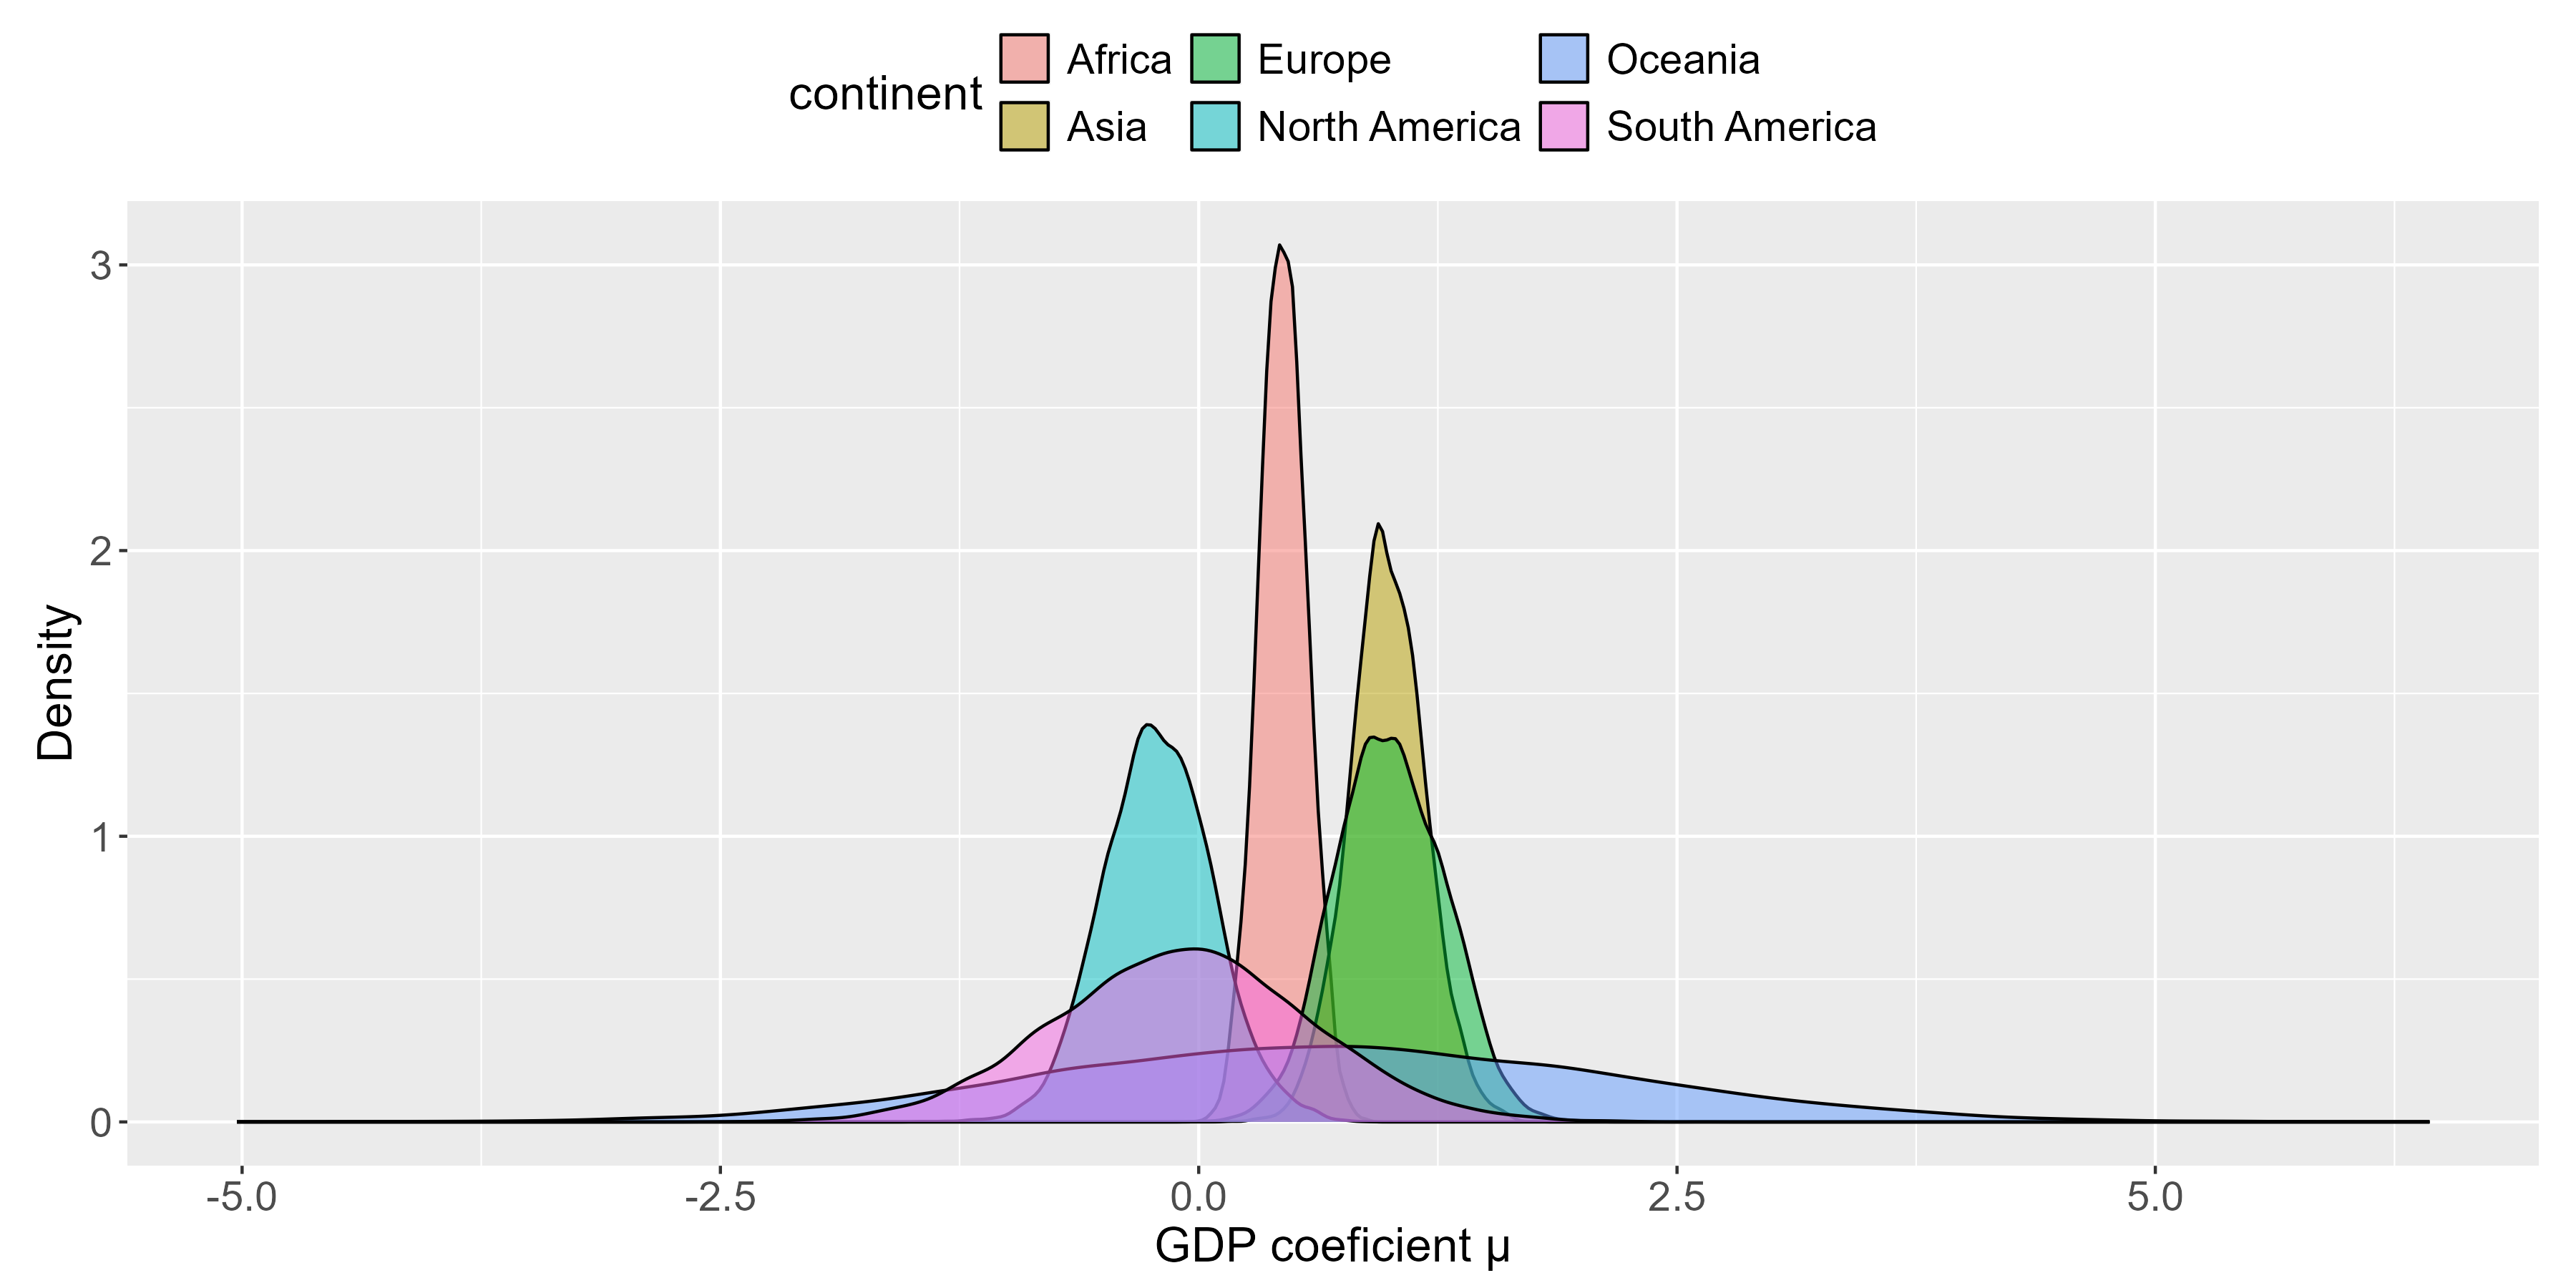
With GDP plot (Figure 5) the picture stays mostly the same.
Africa still has small variance and a mean that shows slight
positive correlation.
The biggest difference is Europe that almost matches
Asia distribution, which is again one of the two extreme cases
of correlation. Interestingly enough the positive and negative
correlation with the happiness score now swaps so North America
is the most negatively correlated and Asia (and also
Europe) being the most positively correlated.
Like with life expectancy Oceania has a very wide distribution
with a large variance and a similar increased variance can be observed
in South Africa.
After analysing the results we can see that there are significant
differences between the correlation of health and wealth, not only that,
the correlation can be very different among those two variables.
Africa is the most consistent with their happiness because of
the small variance. With this continent we also see that health and
wealth do not play a very significant role on the overall
happiness.
In Europe it seem that health likewise does not contribute a
lot to the happiness scores, but the wealth seems to be very important
to europeans.
North America and Asia seem to be mirroring one
another. In Asia a longer life expectancy lowers the happiness
scores. This could hint that the older people are more miserable and
younger asians are happier. On the flip side, like with Europe,
wealth is very positively correlated with happiness. With North
America it is just the opposite. That is interesting especially in
the case of wealth which is negatively correlated with happiness.
South America is similar to Africa in regards to the
wealth. While the variation is higher, the correlation is low and even
slightly negatively correlated. Health in South America is an
important factor since it is positively correlated with happiness, but
not to the extend as in North America.
Lastly Oceania has a very large variation in both health and
wealth correlations which hints very large differences in the life and
happiness reasons of its people.
Discussion
Using a one layer hierarchical model with two different links gave us a better fit with the provided data. The predispositions of a global yearly trend and global intercept are quite strong, but given the questions we were trying to answer and the lacking datapoints of some countries it would be unnecessary to try and fit a full two layer hierarchical model.
The positive yearly trend and a larger than global happiness score was a very welcome discovery.